Outdoor Ambient Air Pollution and
Health Consequences
Scroll

Scroll

Outdoor air pollution is composed of many different types of gas and particle contaminants, including toxic chemicals, from a wide range of sources. Some pollutants are natural like sand, dust, or wildfire smoke and others are man-made like nitrogen oxides from vehicle emissions. Pollutants can be released from specific events, but most pollutants are released as a by-product of our society’s necessary functions: waste and sewage treatment, electricity generation, manufacturing, agriculture, and transportation.
This project focuses on outdoor ambient air pollution– the exposure to air pollutants at low exposures for long periods of time.
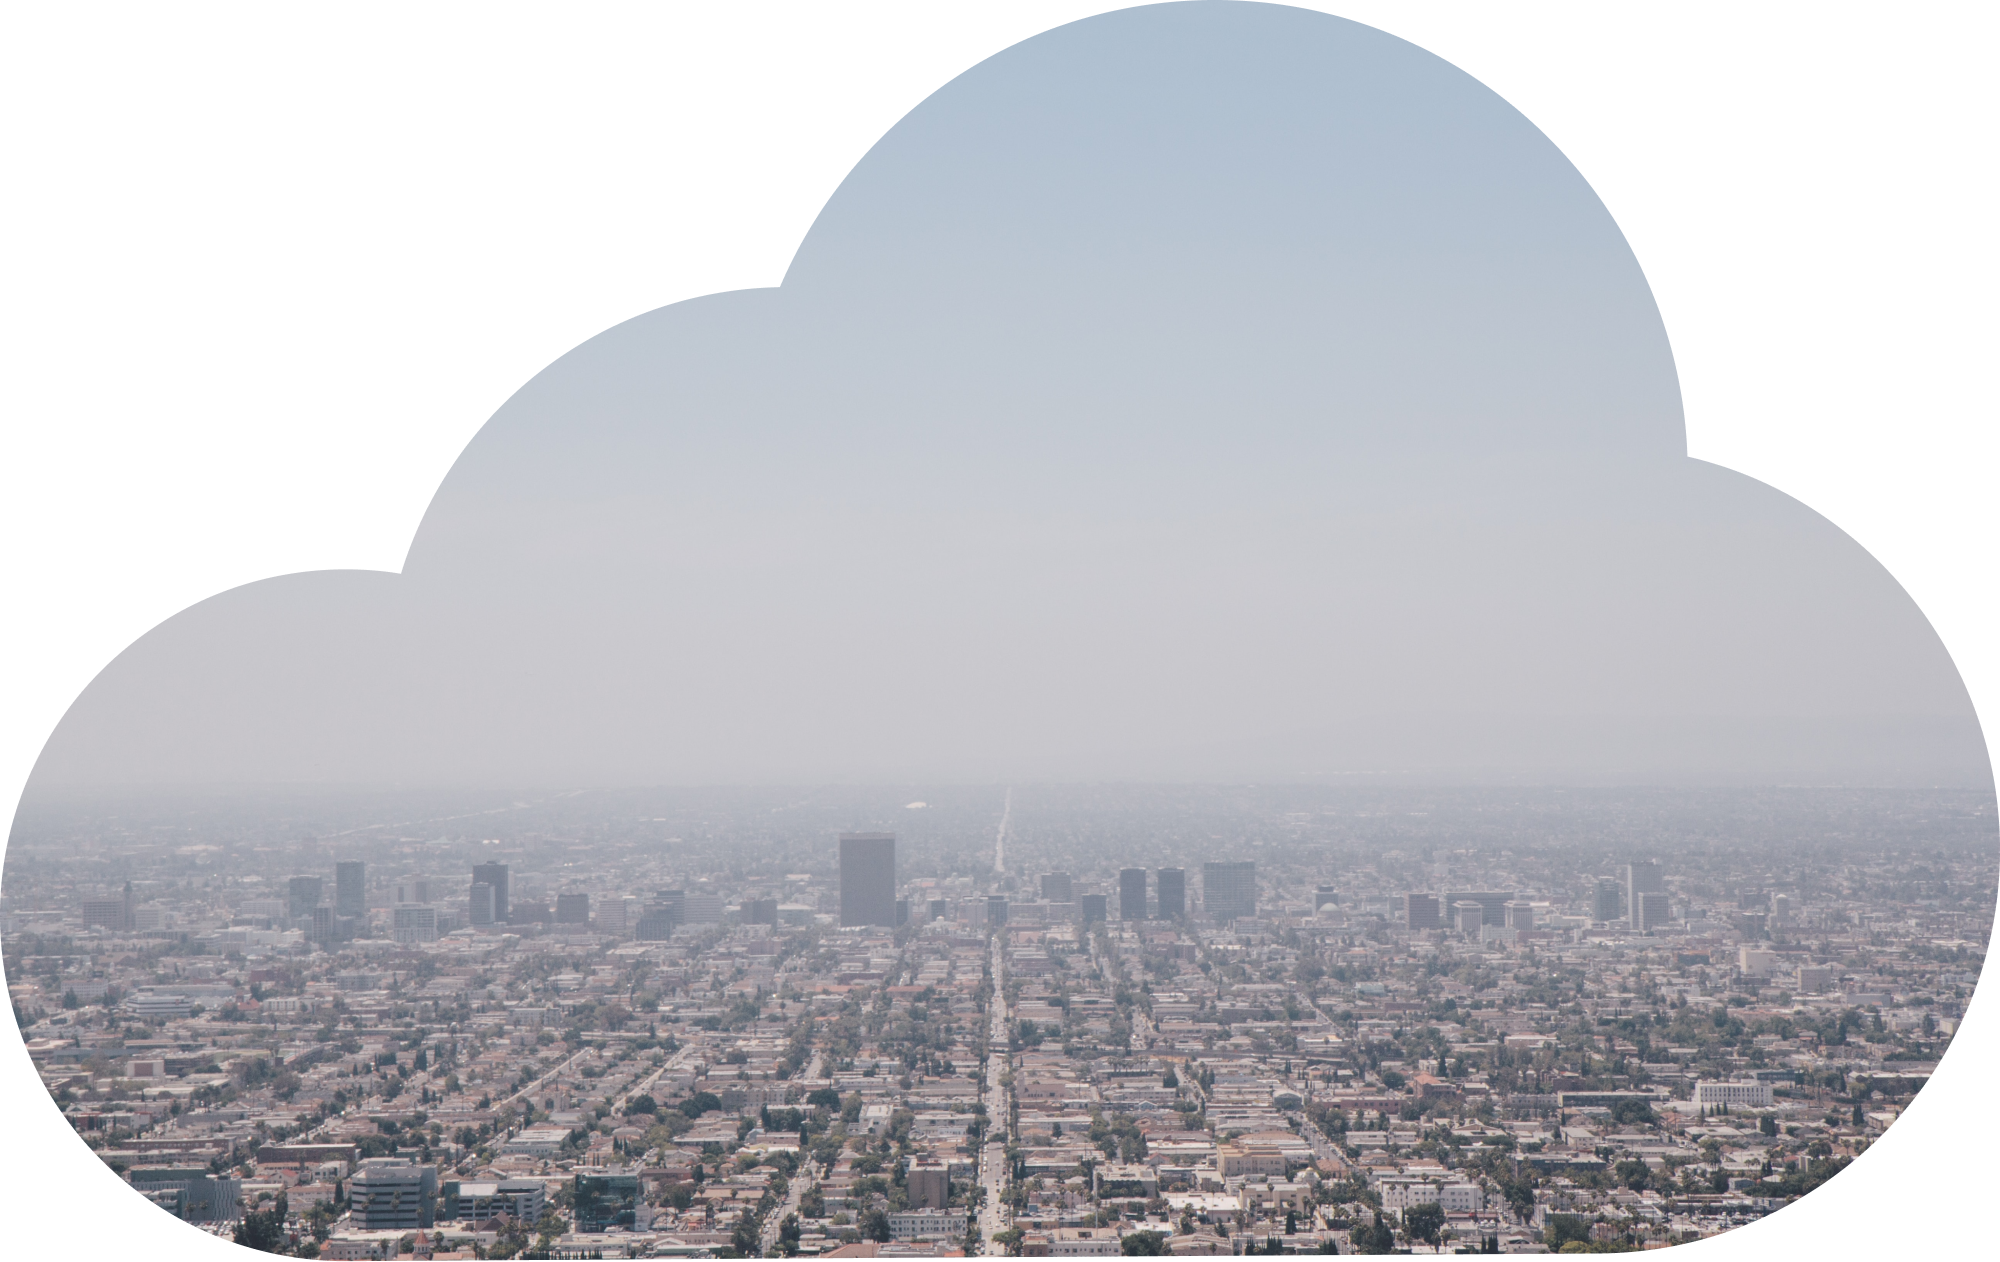
Los Angeles, CA

To regulate air pollution in the United States, President Nixon established the Environmental Protections Agency (EPA) in 1970. Their research, advocacy, and enforcement of environmental and climate legislation is a leader in keeping communities in the U.S. safe.
The US EPA has set national standards on and actively monitors 6 common air pollutants:
Released from mainly car, truck, and other vehicle emissions.

Released from mainly burning fossil fuels in industry facilities.

Released from vehicle emissions and burning fossil fuels.

Released into the air from metal processing plants, waste incinerators, and aircrafts using leaded aviation fuel.

Created through reactions of sunlight with nitrogen oxides and VOCs emitted through combustion processes.

Particles consist of a complex mix of organic and inorganic components. Used as a proxy for air pollution.

Where do these pollutants come from?
According to the EPA’s air pollution report in 2019, emissions come from four main categories:
Stationary Fuel Combustion: electric utilities, industrial boilers
Industrial and Other processes: metal smelters, petroleum refineries, cement kilns, dry cleaners
Highway Vehicles: cars, trucks
Non-road Mobile: recreational and construction equipment, marine vessels, aircraft, locomotives
These radar charts map the distribution of percent contribution of each emission source category per air pollutant. Scroll down to see a combined chart to compare the air pollutants' differences in emission sources.


*Use the drop-down to see an individual pollutant's distribution of source emissions.
Credit: Radar Chart with Selection by Clara Hu
Focusing on Particulate Matter (PM)
Particulate matter has been historial proxy for air pollution because it consists of a combination of organic and inorganic components. These fine particles are so small, we inhale them without even knowing it.
PM is measured by the unit, micron (μm). PM2.5 refers to particulate matter that are 2.5 microns or less in width.
This animation shows the relative size of the cross section of a PM 2.5 particle compared to cross sections of other small particles.
Credit: Particle Sizes by Clara Hu

PM 2.5 Concentrations Around the World
99% of people in the world live in places where air quality is deemed unsafe by the World Health Organization (WHO, 2019).
In 2005, WHO set their guideline for safe annual average PM 2.5 concentration at 10 μg/m3, however in 2021 the value was decreased to 5 μg/m3 reflecting the severity of air pollution harm on population health and wellness.
-- PM2.5 is measured as Annual Population Weighted Average PM2.5 Concentration. This metric links the concentration measured in an area with the number of people living there.
-- Attributable Mortality measures the proportion of non-accidental deaths that were associated with air pollution. The higher the percent attributable mortality, the more air pollution plays a role in the cause of non-accidental deaths in a population.
Explore by brushing an area of points on the scatter plot to map metrics to countries.
Click on an individual point on the plot or country on the map to see its PM2.5 concentration and attributable mortality. Click again to unselect.
Credit: Brushed Scatterplot and Map by Clara Hu
Ambient air pollution has been found to contribute to many non-communicable diseases.
PM 2.5 is the primary pollutant studied by public health and environmental researchers. Because of the size of PM 2.5, it enters our lungs, respiratory system, and even passes through the blood brain barrier.
PM2.5 matters because it has serious health consequences. Exposures to particulate matter result in higher risk of cardiovascular complications, respiratory non-communicable diseases, and cognitive health disorders.
Credit: Word Visualization for INFO 247 Final Project by Astoria
In 2019, an estimated
3,832,670
people died from air pollutant related conditions.

Air pollution contributes to disease mortality.
In 2021, the Health Effect Institute (HEI) released a research report on ambient air pollution around the world and air pollution’s disease burden for certain non-communicable diseases as attributable mortality rates. This report is the first to make global estimates on population PM 2.5 exposure and global trends between air pollution and health.
We summarize disease-specific attributable mortality findings from the McDuffie et al. (2021) report from the Global Burdens of Disease 2019 CRF (concentration-response functions) model for the four most common causes of death.


Chronic obstructive pulmonary disease (COPD) is a lung condition where the lungs struggle to push air in and out, overall decreasing lung capacity. Air pollution is linked to increased risks of and exacerbating COPD symptoms.

Ischemic heart disease is the buildup of plaque in heart arteries which limit blood and oxygen circulation in the body. Studies found long-term exposure to air pollution accelerates calcium buildup in arteries.


Lower respiratory tract infections (LRI) are infections that take place in the trachea, bronchi, and lungs such as pneumonia, bronchitis, or the flu. Rates of LRI found in both children and adults have been highly correlated with air pollution.
Strokes are found to be positively associated with increased ambient air pollution or dust storms. As air pollution worsens, an increased number of cardiovascular events occur.

How can we protect ourselves from outdoor ambient air pollution?
Researchers are studying strategies that reduce population and individual exposure to outdoor ambient air pollution. We look at three personal interventions studied by Laumbach et al. (2021) with varying effectiveness: N95 masks, air filters, and staying inside.
The animations represent the ability of interventions to reduce particle exposure.
Blue dots have been effectively kept out.
Red dots have passed through.
N95, KN95, FFP2 Masks
95% filtration of PM
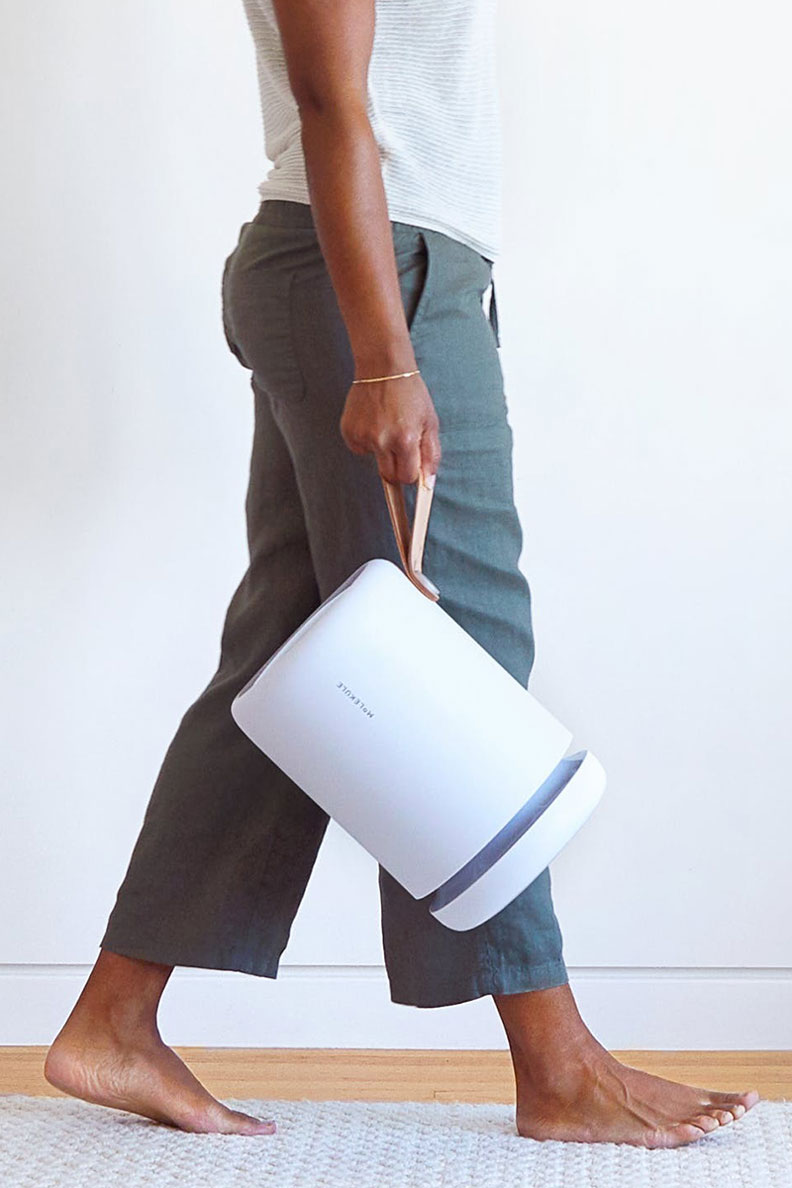
Indoor Air Filters
~70% filtration of PM
**Air filter effectiveness depends on type of filter, placement, and frequency of use. Outdoor air pollution affects people even when they are not outside. PM can enter through windows, vents, and other openings.
Staying indoors with windows shut
~20% filtration of Ozone
**For PM 2.5, this strategy is not effective.
The variability on filtration depends on the building's windows, building materials, and filtration system.
Combatting Air Pollution as a Trend
With the ongoing COVID pandemic and increasing frequency of wildfires, we have become more aware about the air we breathe. More and more consumer products around personal protection from air pollution are hitting the shelves -- take a look at a few below.
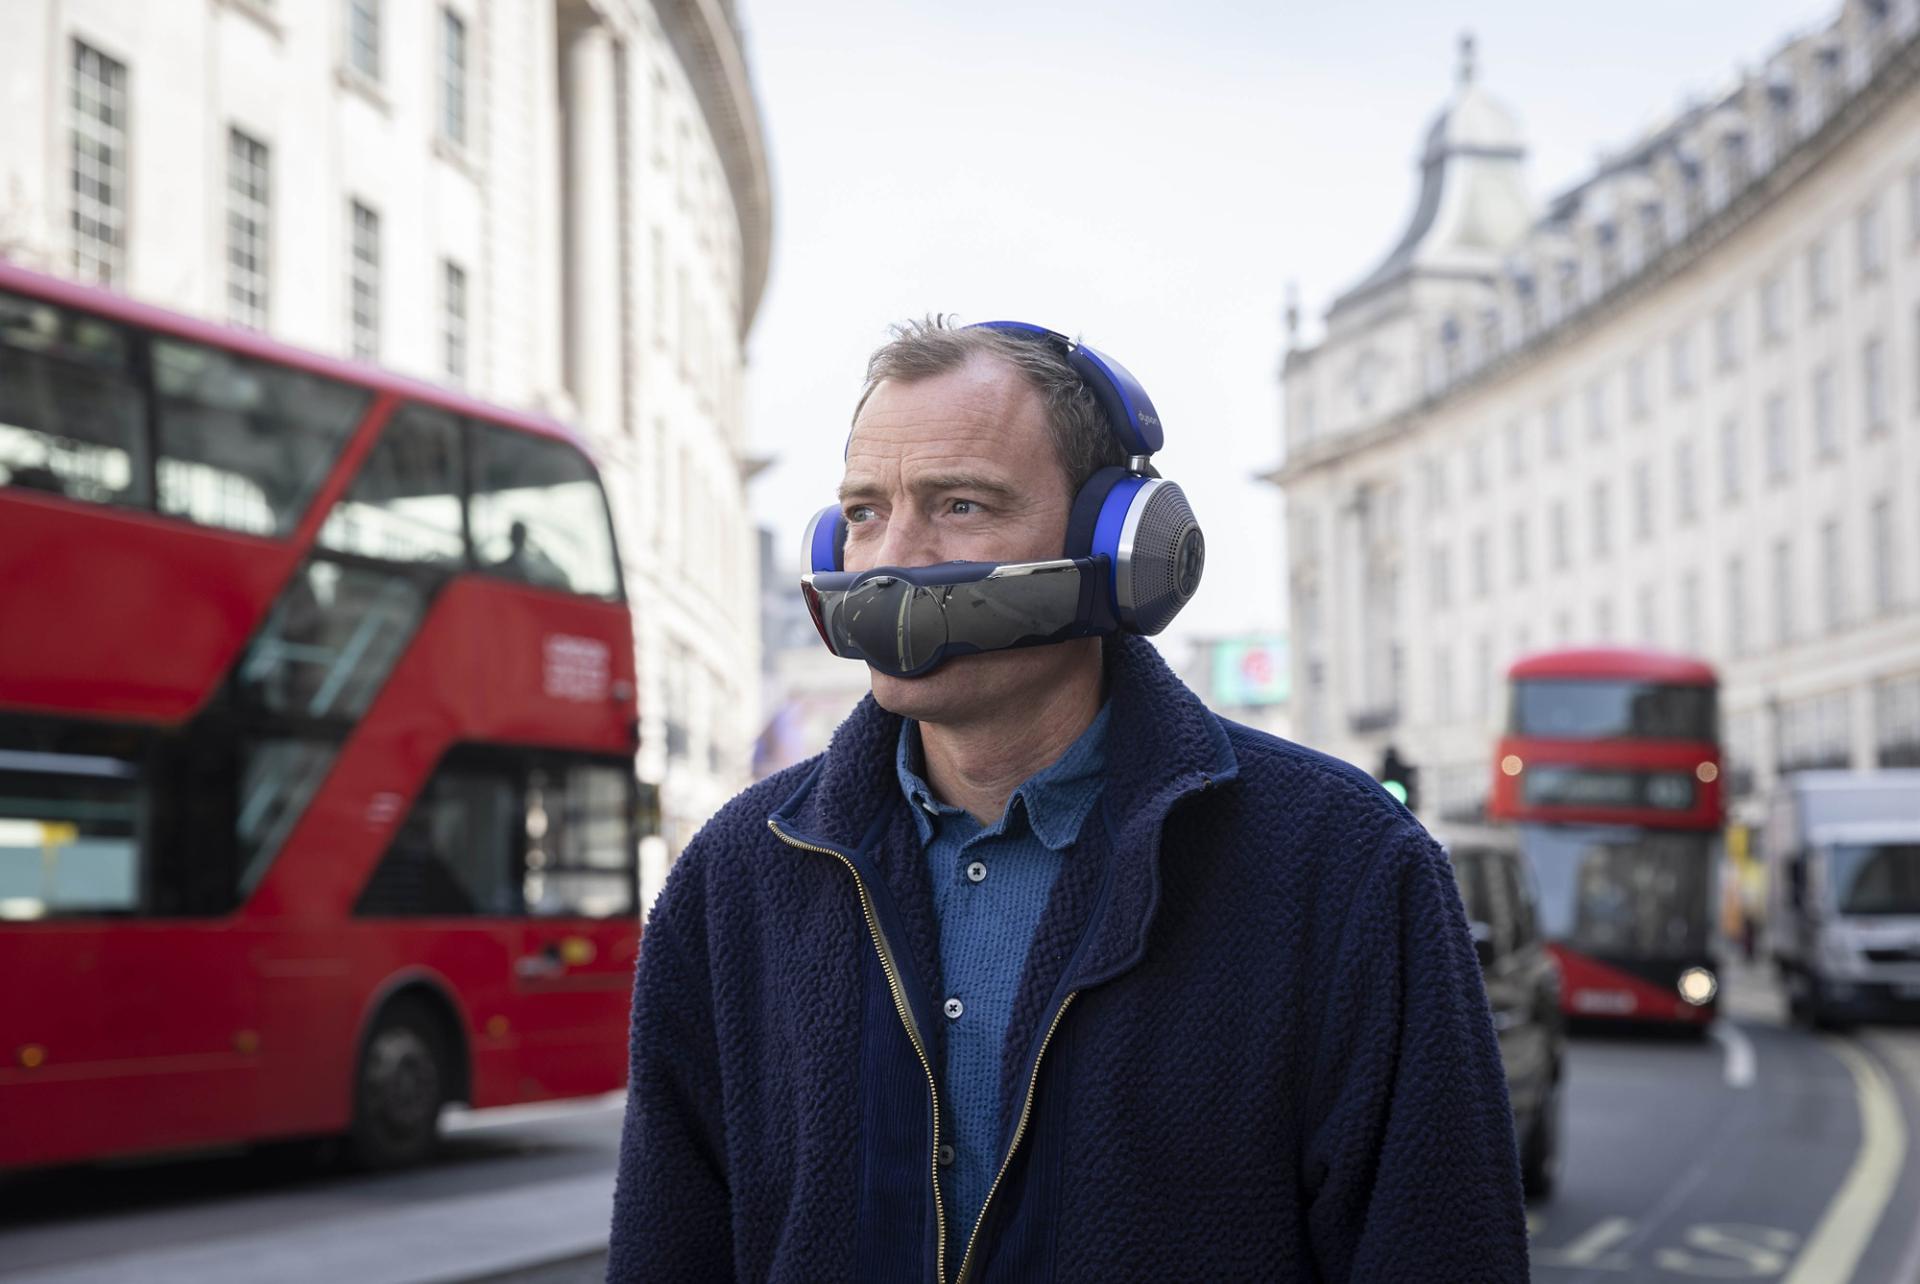 Dyson, 2022
Dyson created their Dyson Zone, air purifying headphones, in 2022.
 Xupermask, 2022
Will.i.am x Honeywell partnered to created the XUPERMASK in 2021.
 Metro Style, 2020
Small portable air filters like this necklace have also been sold, but its effectiveness is unclear.
In 2019, President Rodrigo Duterte of the Philippines was seen wearing an air purifier necklace to public appearances.
 Verge (LG), 2020
LG released PuriCare™ Wearable Air Purifier in 2020.
Conclusion
Clean air is essential to human health. In 2021, the World Health Organization set higher standards for nearly every pollutant it monitors, even slashing their recommended air quality guideline for PM2.5 in half, from 10μg/m3 to 5μg/m3, indicating the severity of air pollution as a health threat. As the adverse health effects of air pollution become more studied and apparent, individuals and organizations are taking action to improve air quality and pressure governments to pass stricter regulations on air pollution emissions.
Organizations around the world, such as the California-based Coalition for Clean Air and London-based Little Ninja are taking part in initiatives to educate the public and especially children on the importance of clean air and the dangers of polluted air. Other organizations such as Mom’s Clean Air Force in the United States campaign for local policy issues to fight air pollution. Individuals, too, are taking part– from writing and educating on the issue to driving less and using less energy.
What actions will you take?

References:
Clara Hu and Astoria Ho - INFO 247 Final Project (Spring 2022)